And as the chart also shows (left hand panel), a large chunk of that extra spending was funded by increased borrowing. Again, Brown moved from borrowing roughly the same, or less, than other governments (as a percent of GDP), to borrowing more than the others - and that of course, is only the official debt, not including off-balance sheet Enron items. And where do we go now? The OECD emphasises the vital importance of clear fiscal rules, setting out a clear path back to sanity. However, crucially, the new rules must deal with spending as well as borrowing, they must encompass Enron debt, and they must be honestabout so-called fiscal drag: "The original fiscal rules could be amended in a number of ways, rather than being reinstated. The reformulated rules should be forward looking, ensure medium-term spending discipline and account more explicitly for off balance sheet public liabilities. Finally, income tax thresholds and national insurance thresholds should be linked to wage, rather than price inflation so that fiscal drag is handled more transparently." We have long called for such rules, and in current circs, they are more vital than ever. We simply cannot leave things to unfettered political discretion. Not only would that consign us and our grandchildren to a life of low growth, high debt, and high taxes, but more immediately, it would expose us to a collapse of market confidence, even worse than we saw in the sixties and seventies (eg see this blog). And trust me - we really don't want to go there. So let's have one more go. George, if you're listening, please tell us you misspoke yourself in Birmingham last October (see this blog). Please tell us you do agree with the OECD, and that Britain does needs clear fiscal rules, including a spending rule. And please tell us what those rules are going to be. Because I'll tell you this: if you don't set out a medium term fiscal strategy - backed up by clearly stated rules - you are going to have an even tougher time as Chancellor than everyone is now saying. You are going to be making swingeing public spending cuts, but they will not be embedded in a bankable strategy, the kind of strategy the markets will demand. You are going to be facing down the howls of anguish all around you, without even getting the market credit you will need. Indeed, the louder the howls, the more the markets will worry about a Heathite U-turn. You will stand in real danger of repeating the experience of the Wilson government - a whole series of hand-to-mouth emergency budgets, all of which cut spending (and raise taxes), but none of which get you on the front-foot with the markets. Is that what you want? Cos that's what you're going to get. PS There are a number of other interesting charts in the OECD report. Here's an update of one we've posted before, which shows how - despite all the promises and all the plans and all the best intentions in the world - Britain is top of the OECD league in terms of social immobility. Specifically, the chart shows what's known as Intergenerational Earnings Elasticity - the extent to which your parents' income level determines your own - the higher the parameter, the higher is the persistence of earnings across generations and thus the lower is mobility: Labels: cuts, fiscal policyTHURSDAY, JULY 02, 2009
http://burningourmoney.blogspot.com/
OECD Verdict On Labour

The OECD has just published its latest Economic Survey of the United Kingdom. And it's a pretty damning verdict on 12 years of Labour government.
To start with, the OECD reminds us exactly where Brown's, ahem, "economic miracle" came from - a huge government spending splurge, combined with easy credit.
On government spending, the following chart graphically illustrates how spending soared after Brown turned on the taps in 2000 (right hand panel). In the following 8 years, it rose by getting on for 10 percent of GDP, and that at a time when GDP itself was rising strongly:
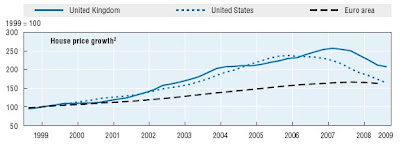
So from being comfortably below the average of other G7 countries throughout the nineties, the UK's public spending burden overtook the average in 2005, and has not looked back."Although the credit cycle touched many assets and countries, the UK housing cycle was particularly intense: nominal house prices more than doubled in the ten years to their peak. The asset-price and credit boom was self-perpetuating for a time, as easy availability of credit stoked demand and raised asset prices, which in turn increased the value of collateral and engendered further borrowing. In the end, this proved unsustainable."
The following chart shows how our house prices spiralled way beyond even the excesses in the US, and have still not got back on track:
Spot on. So after 12 years of Labour's fairnessandoppportunityforallthemanynotthefewwhat are we to make of that? Speaking as someone who had the great good fortune to grow up on a council estate, and progress via state grammar school to Oxford University and a well rewarded career in the City, I have absolutely no idea. It's a complete mystery.
Thursday, 2 July 2009
Posted by
Britannia Radio
at
20:02
![]()


